Step 1: Get the Sample Chart and Test
To begin, get the sample Grafana Helm chart from Bitnami, install the chart in your cluster using the Helm CLI, and then uninstall. The purpose of this step is to confirm that you can successfully install and access the application before adding the chart to a release in the Replicated vendor platform.
To get the sample Grafana chart and test installation:
-
Run the following command to pull and untar version 9.6.5 of the Bitnami Grafana Helm chart:
helm pull --untar oci://registry-1.docker.io/bitnamicharts/grafana --version 9.6.5For more information about this chart, see the bitnami/grafana repository in GitHub.
-
Change to the new
grafanadirectory that was created:cd grafana -
View the files in the directory:
lsThe directory contains the following files:
Chart.lock Chart.yaml README.md charts templates values.yaml -
Install the chart in your cluster:
helm install grafana . --namespace grafana --create-namespaceTo view the full installation instructions from Bitnami, see Installing the Chart in the
bitnami/grafanarepository.After running the installation command, the following output is displayed:
NAME: grafana
LAST DEPLOYED: Thu Dec 14 14:54:50 2023
NAMESPACE: grafana
STATUS: deployed
REVISION: 1
TEST SUITE: None
NOTES:
CHART NAME: grafana
CHART VERSION: 9.6.5
APP VERSION: 10.2.2

** Please be patient while the chart is being deployed **

1. Get the application URL by running these commands:
   echo "Browse to http://127.0.0.1:8080"
   kubectl port-forward svc/grafana 8080:3000 &

2. Get the admin credentials:

   echo "User: admin"
   echo "Password: $(kubectl get secret grafana-admin --namespace grafana -o jsonpath="{.data.GF_SECURITY_ADMIN_PASSWORD}" | base64 -d)"
# Note: Do not include grafana.validateValues.database here. See https://github.com/bitnami/charts/issues/20629 -
Watch the
grafanaDeployment until it is ready:kubectl get deploy grafana --namespace grafana --watch -
When the Deployment is created, run the commands provided in the output of the installation command to get the Grafana login credentials:
echo "User: admin"
echo "Password: $(kubectl get secret grafana-admin --namespace grafana -o jsonpath="{.data.GF_SECURITY_ADMIN_PASSWORD}" | base64 -d)" -
Run the commands provided in the ouptut of the installation command to get the Grafana URL:
echo "Browse to http://127.0.0.1:8080"
kubectl port-forward svc/grafana 8080:3000 --namespace grafananoteInclude
--namespace grafanain thekubectl port-forwardcommand. -
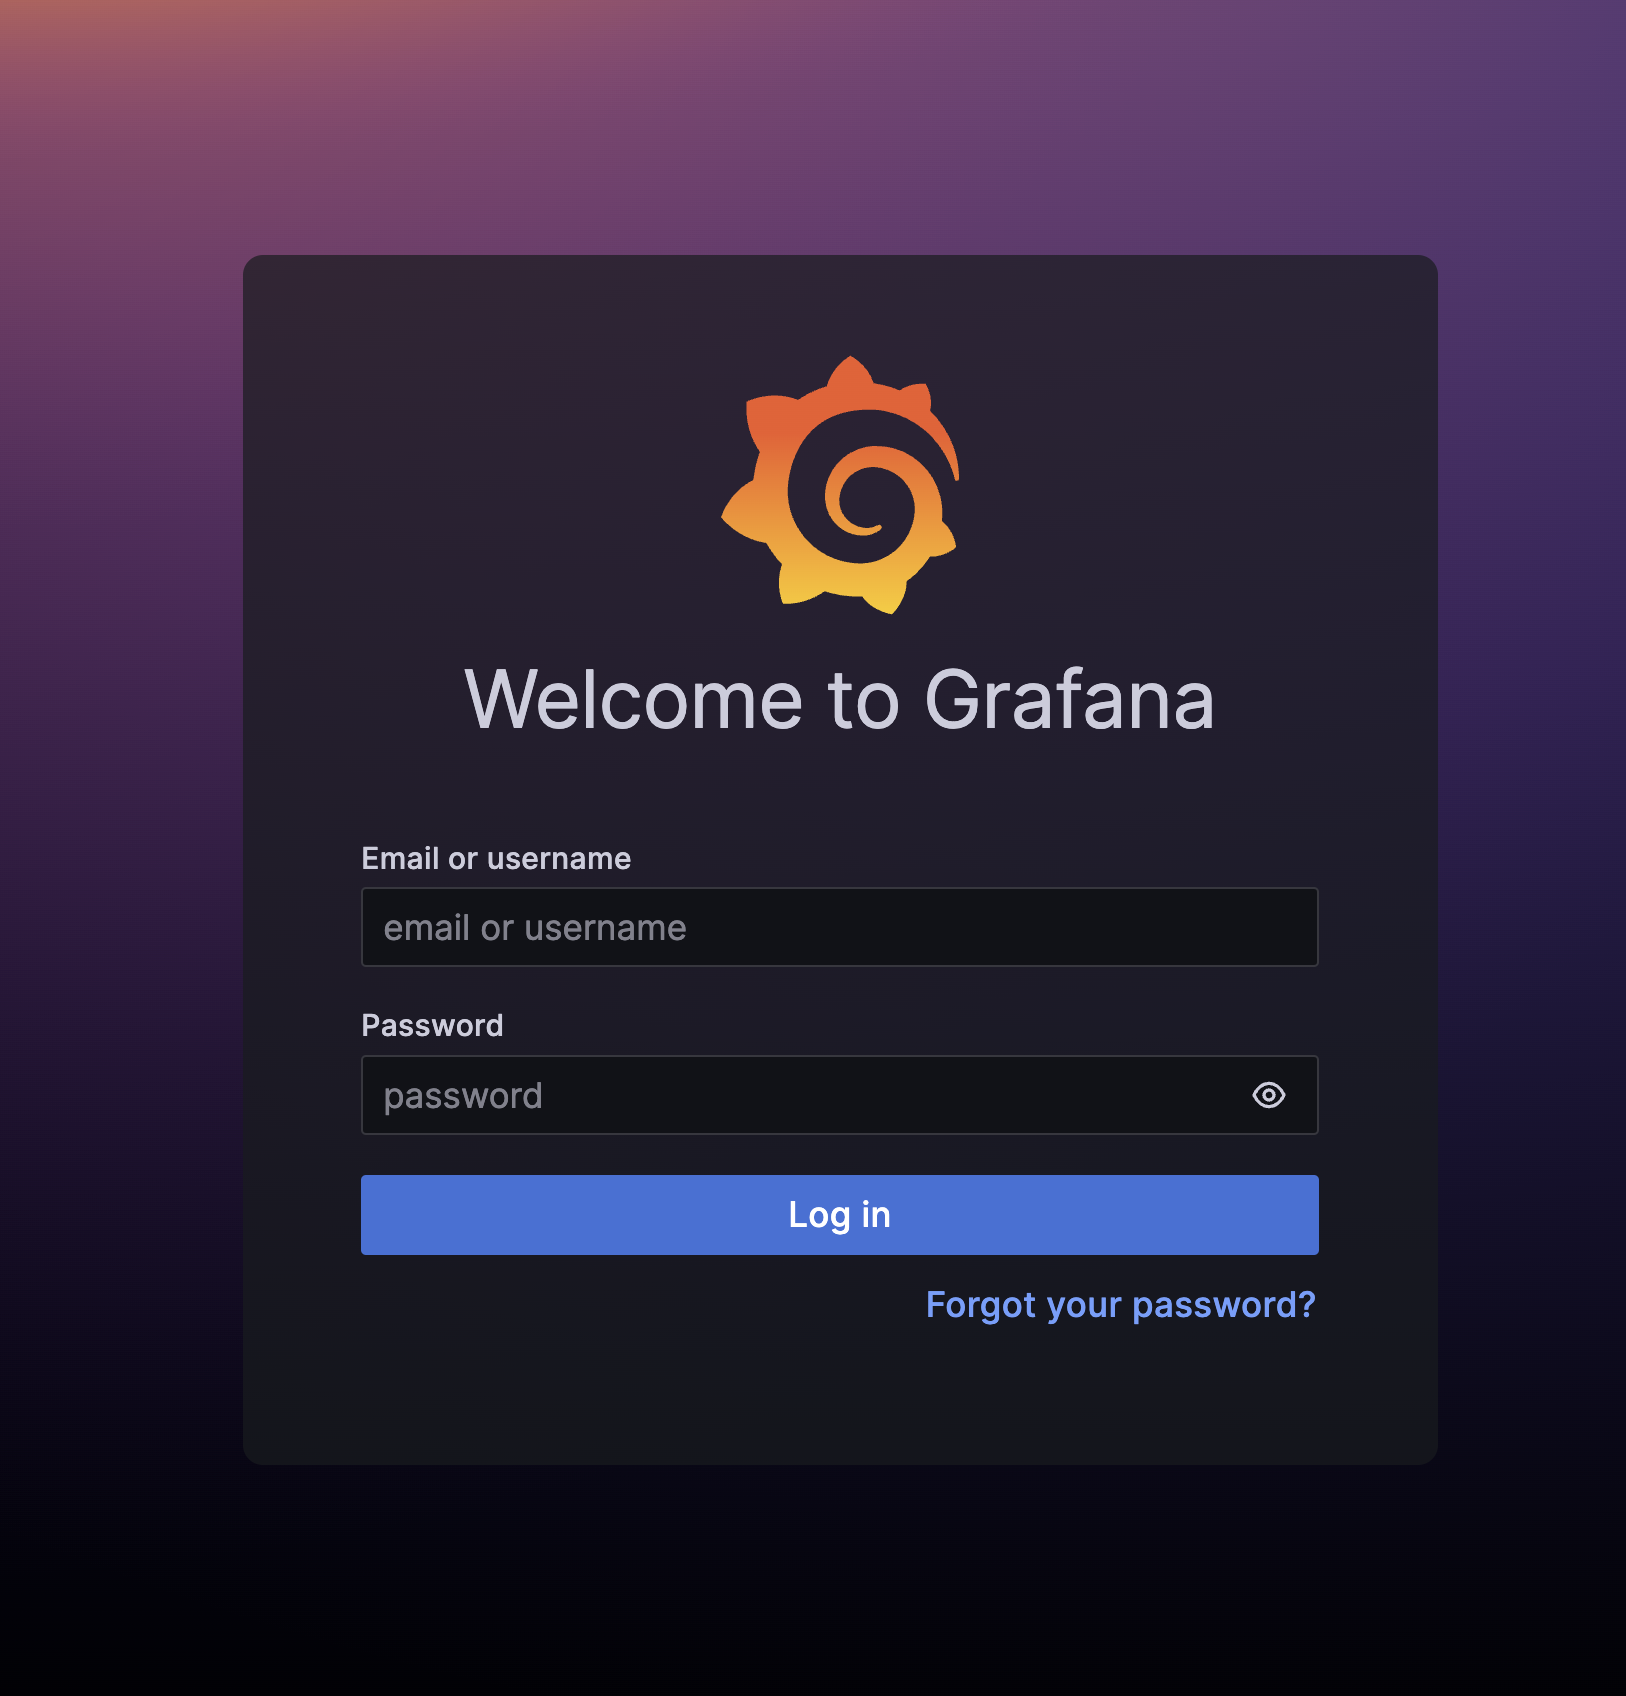
In a browser, go to the URL to open the Grafana login page:
-
Log in using the credentials provided to open the Grafana dashboard:

-
Uninstall the Helm chart:
helm uninstall grafana --namespace grafanaThis command removes all the Kubernetes resources associated with the chart and uninstalls the
grafanarelease. -
Delete the namespace:
kubectl delete namespace grafana
Next Step
Log in to the Vendor Portal and create an application. See Step 2: Create an Application.