Monitoring Applications with Prometheus
This topic describes monitoring applications and clusters with Prometheus. It includes information about how to configure Prometheus monitoring for existing clusters and how to access the dashboard using a port forward.
Overview
For installations in existing clusters and in Replicated kURL clusters, the Replicated KOTS Admin Console uses the open source systems monitoring tool Prometheus to collect metrics on an application and the cluster where the application is installed. Prometheus components include the main Prometheus server, which scrapes and stores time series data, an Alertmanager for alerting on metrics, and Grafana for visualizing metrics. For more information about Prometheus, see What is Prometheus? in the Prometheus documentation.
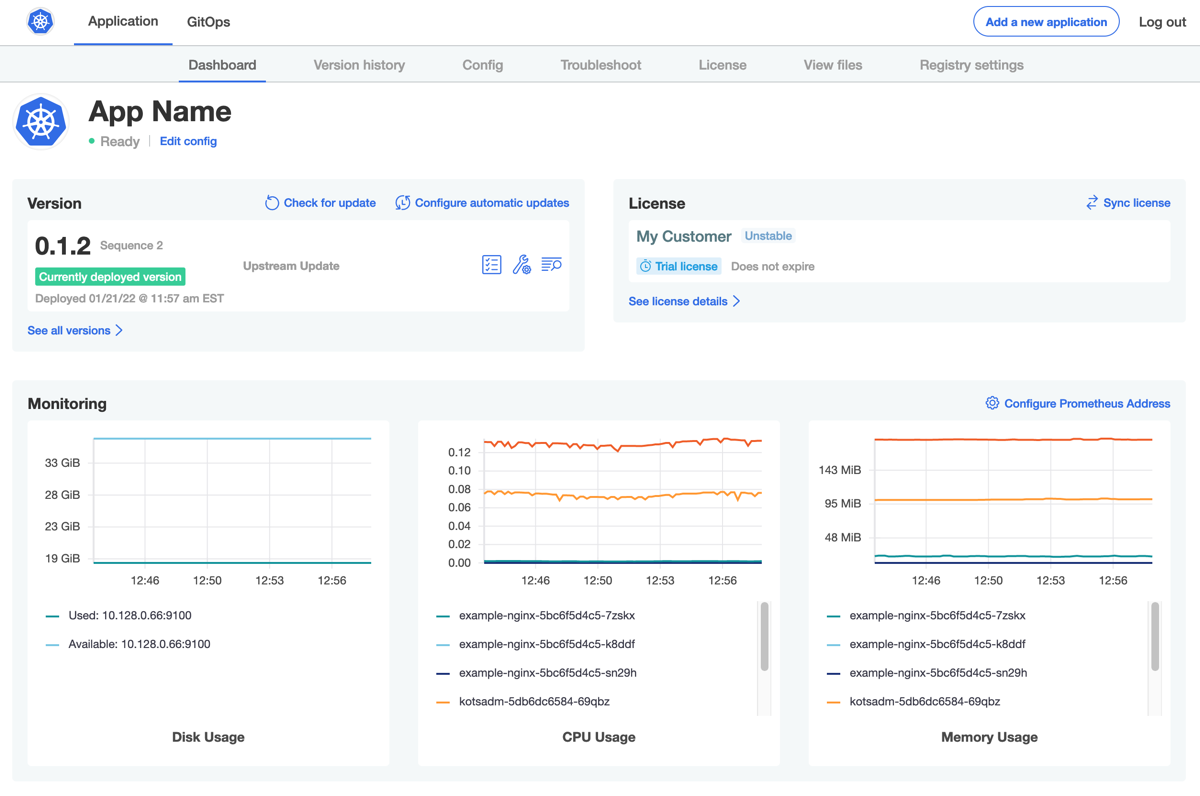
The Admin Console exposes graphs with key metrics collected by Prometheus in the Monitoring section of the dashboard. By default, the Admin Console includes the following graphs:
- Cluster disk usage
- Pod CPU usage
- Pod memory usage
In addition to these default graphs, application developers can also expose business and application level metrics and alerts on the dashboard.
The following screenshot shows an example of the Monitoring section on the Admin Console dashboard with the Disk Usage, CPU Usage, and Memory Usage default graphs.
View a larger version of this image
For kURL installations, if the kURL Prometheus add-on is included in the kURL installer spec, then the Prometheus monitoring system is installed alongside the application. No additional configuration is required to collect metrics and view any default and custom graphs on the Admin Console dashboard. For more information about configuring kURL installers, see Creating a kURL Installer.
For existing cluster installations with KOTS, users can install Prometheus and connect the Admin Console to the Prometheus endpoint to enable monitoring. For information about how to set up Prometheus monitoring in existing clusters, see Configure Monitoring in Existing Clusters.
Limitation
Monitoring applications with Prometheus is not supported for installations with Replicated Embedded Cluster.
Configure Monitoring in Existing Clusters
To configure Prometheus monitoring for applications installed in an existing cluster, connect the Admin Console to the endpoint of an installed instance of Prometheus on the cluster. See the following sections:
Install Prometheus
Replicated recommends that you use CoreOS's Kube-Prometheus distribution for installing and configuring highly available Prometheus on an existing cluster. For more information, see the kube-prometheus GitHub repository.
This repository collects Kubernetes manifests, Grafana dashboards, and Prometheus rules combined with documentation and scripts to provide easy to operate end-to-end Kubernetes cluster monitoring with Prometheus using the Prometheus Operator.
To install Prometheus using the recommended Kube-Prometheus distribution:
-
Clone the kube-prometheus repository to the device where there is access to the cluster.
-
Use
kubectl
to create the resources on the cluster:# Create the namespace and CRDs, and then wait for them to be available before creating the remaining resources
kubectl create -f manifests/setup
until kubectl get servicemonitors --all-namespaces ; do date; sleep 1; echo ""; done
kubectl create -f manifests/For advanced and cluster-specific configuration, you can customize Kube-Prometheus by compiling the manifests using jsonnet. For more information, see the jsonnet website.
For more information about advanced Kube-Prometheus configuration options, see Customizing Kube-Prometheus in the kube-prometheus GitHub repository.
Connect to a Prometheus Endpoint
To view graphs on the Admin Console dashboard, you must provide the address of the Prometheus instance that you installed on the cluster.
To connect the Admin Console to a Prometheus endpoint:
-
On the Admin Console dashboard, under Monitoring, click Configure Prometheus Address.
-
Enter the address for the Prometheus endpoint in the text box and click Save.
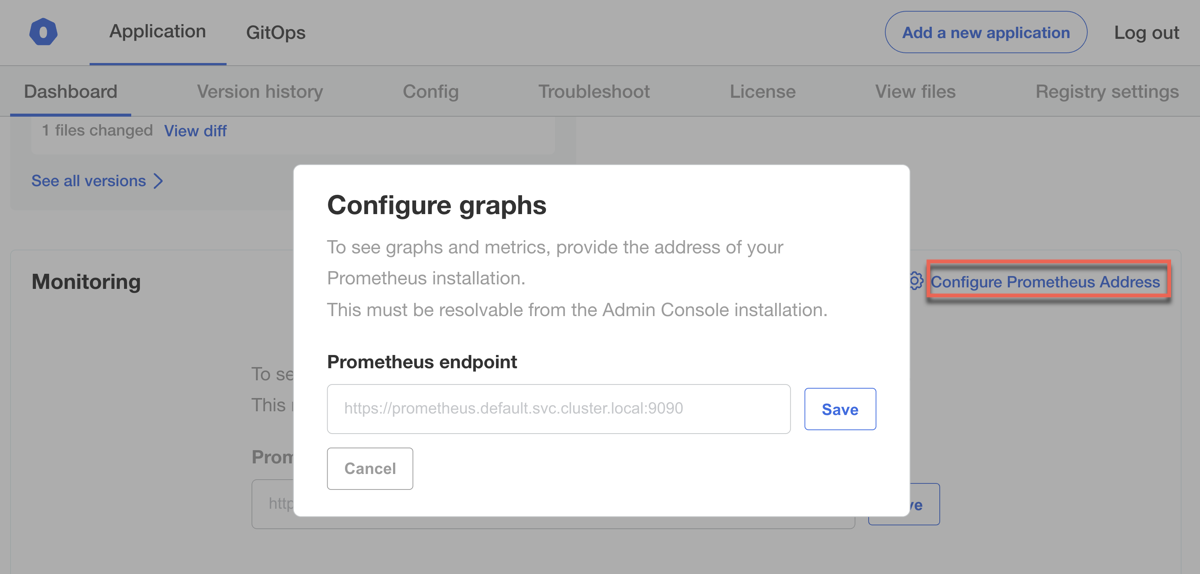
Graphs appear on the dashboard shortly after saving the address.
Access the Dashboards with kubectl Port Forward
You can use the commands below to access Prometheus, Grafana, and Alertmanager dashboards using kubectl port-forward
after you install the manifests.
You can also expose these pods on NodePorts or behind an ingress controller. This is an advanced use case. For information about exposing the pods on NodePorts, see NodePorts in the kube-prometheus GitHub repository. For information about exposing the pods behind an ingress controller, see Expose via Ingress in the kube-prometheus GitHub repository.
For Replicated kURL clusters, you can consume Prometheus metrics from an external monitoring solution by connecting to the Prometheus NodePort service running in the cluster. For more information, see Consuming Prometheus Metrics Externally.
Access Prometheus
To access the Prometheus dashboard with a port forward:
-
Run the following command to create the port forward:
kubectl --namespace monitoring port-forward svc/prometheus-k8s 9090
-
Access the dashboard at http://localhost:9090.
Access Grafana
To access the Grafana dashboard with a port forward:
-
Run the following command to create the port forward:
kubectl --namespace monitoring port-forward deployment/grafana 3000
-
Access the dashboard at http://localhost:3000.
-
Log in to Grafana:
-
Existing cluster: Use the default Grafana username and password:
admin:admin
. -
kURL cluster: The Grafana password is randomly generated by kURL and is displayed on the command line after kURL provisions the cluster. To log in, use this password generated by kURL and the username
admin
.To retrieve the password, run the following kubectl command:
kubectl get secret -n monitoring grafana-admin -o jsonpath="{.data.admin-password}" | base64 -d
-
Access Alertmanager
To access the Alertmanager dashboard with a port forward:
-
Run the following command to create the port forward:
kubectl --namespace monitoring port-forward svc/prometheus-alertmanager 9093
-
Access the dashboard at http://localhost:9093.
About Visualizing Metrics with Grafana
In addition to the Prometheus Expression Browser, Grafana and some preconfigured dashboards are included with Kube-Prometheus for advanced visualization.
For information about configuring Grafana, see the Grafana documentation.
For information about constructing Prometheus queries, see the Querying Prometheus in the Prometheus documentation.
For information about the Prometheus Expression Browser, see Expression Browser in the Prometheus documentation.
About Alerting with Prometheus
Alerting with Prometheus has two phases:
- Alerting rules in Prometheus servers send alerts to an Alertmanager.
- The Alertmanager then manages those alerts, including silencing, inhibition, aggregation, and sending out notifications through methods such as email, on-call notification systems, and chat platforms.
For more information about configuring Alertmanager, see Configuration in the Prometheus documentation.