Consume Prometheus metrics externally
Replicated kURL is available only for existing customers. If you are not an existing kURL user, use Replicated Embedded Cluster instead. For more information, see Use Embedded Cluster.
kURL is a Generally Available (GA) product for existing customers. For more information about the Replicated product lifecycle phases, see Support Lifecycle Policy.
This topic describes how to consume Prometheus metrics in Replicated kURL clusters from a monitoring service that is outside the cluster.
For information about how to access Prometheus, Grafana, and Alertmanager, see Accessing Dashboards Using Port Forwarding.
Overview
The KOTS Admin Console can use the open source systems monitoring tool Prometheus to collect metrics on an application and the cluster where the application is installed. Prometheus components include the main Prometheus server, which scrapes and stores time series data, an Alertmanager for alerting on metrics, and Grafana for visualizing metrics. For more information about Prometheus, see What is Prometheus? in the Prometheus documentation.
The Admin Console exposes graphs with key metrics collected by Prometheus in the Monitoring section of the dashboard. By default, the Admin Console displays the following graphs:
- Cluster disk usage
- Pod CPU usage
- Pod memory usage
In addition to these default graphs, application developers can also expose business and application level metrics and alerts on the dashboard.
The following screenshot shows an example of the Monitoring section on the Admin Console dashboard with the Disk Usage, CPU Usage, and Memory Usage default graphs:
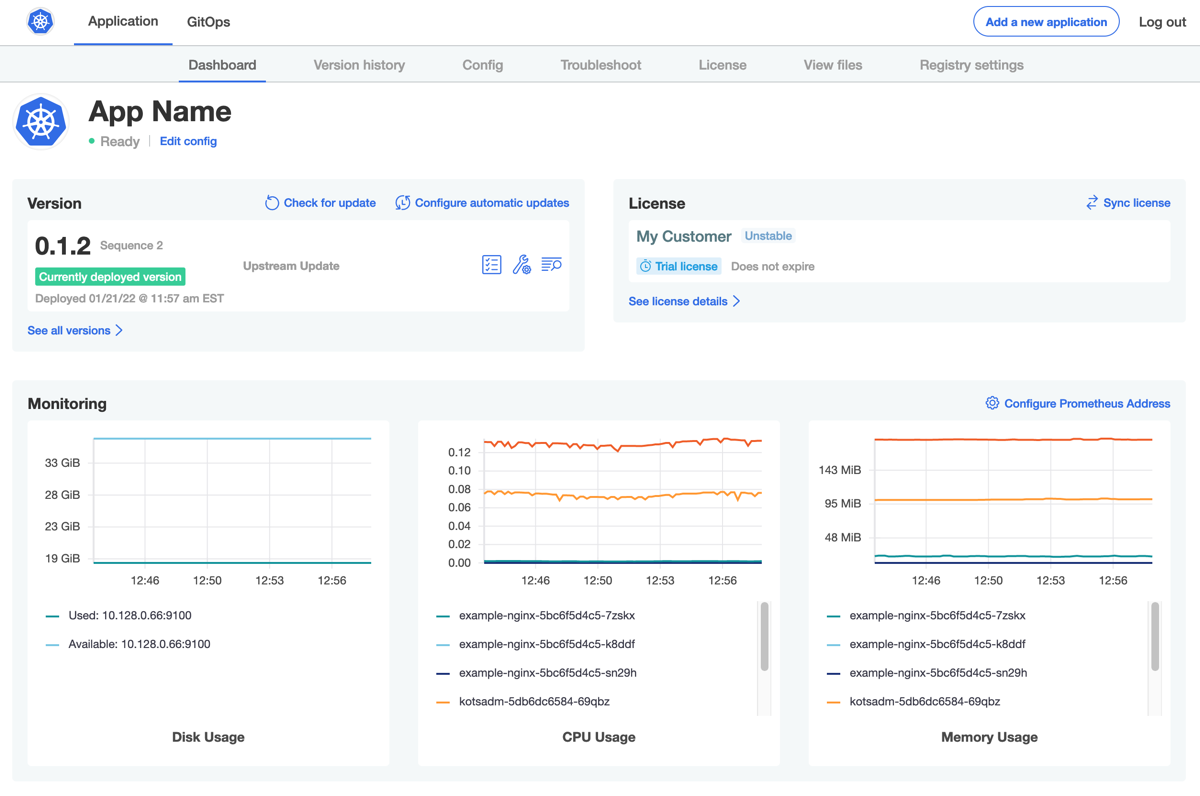
View a larger version of this image
For kURL installations, if the kURL Prometheus add-on is included in the kURL installer spec, then the Prometheus monitoring system is installed alongside the application. No additional configuration is required to collect metrics and view any default and custom graphs on the Admin Console dashboard.
Prometheus is deployed in kURL clusters as a NodePort service named prometheus-k8s in the monitoring namespace. The prometheus-k8s service is exposed on the IP address for each node in the cluster at port 30900.
You can run the following command to view the prometheus-k8s service in your cluster:
kubectl get services -l app=kube-prometheus-stack-prometheus -n monitoring
The output of the command includes details about the Prometheus service, including the type of service and the ports where the service is exposed. For example:
NAME            TYPE      CLUSTER_IP   EXTERNAL_IP  PORT(S)         AGE
prometheus-k8s  NodePort  10.96.2.229  <none>       9090:30900/TCP  5hr
As shown in the example above, port 9090 on the prometheus-k8s service maps to port 30900 on each of the nodes.
For more information about NodePort services, see Type NodePort in Services in the Kubernetes documentation.
Prerequisite
Before you can consume Prometheus metrics in kURL clusters externally, ensure that firewall rules on all nodes in the cluster allow inbound TCP traffic on port 30900.
Consume metrics from external services
You can connect to the prometheus-k8s service on port 30900 from any node in the cluster to access Prometheus metrics emitted by kURL clusters.
To consume Prometheus metrics from an external service:
-
Get the external IP address for one of the nodes in the cluster. You will use this IP address in the next step to access the
prometheus-k8sservice.You can find the IP address for a node in the output of the following command:
kubectl describe node NODE_NAMEWhere
NODE_NAMEis the name of a node in the cluster.noteDepending on the node's network configuration, there might be different IP addresses for accessing the node from an external or internal network. For example, the IP address 10.128.0.35 might be assigned to the node in the internal network, whereas the IP address used to access the node from external or public networks is 34.28.178.93.
Consult your infrastructure team to assist you in determining which IP address to use.
-
In a browser, go to
http://NODE_IP_ADDRESS:30900to verify that you can connect to theprometheus-k8sNodePort service. ReplaceNODE_IP_ADDRESSwith the external IP address that you copied in the first step. For example,http://34.28.178.93:30900.If the connection is successful, the Prometheus UI displays in the browser.
-
From your external monitoring solution, add Prometheus as an HTTP data source using the same URL from the previous step:
http://NODE_IP_ADDRESS:30900.