Understand application status details in the Admin Console
This topic describes how to view the status of an application on the Replicated KOTS Admin Console dashboard. It also describes how Replicated KOTS collects and aggregates the application status.
Replicated KOTS is available only for existing customers. For supporting installations into customer managed clusters, we recommend Helm. For more information, see About Helm Installations with Replicated.
KOTS is a Generally Available (GA) product for existing customers. For more information about the Replicated product lifecycle phases, see Support Lifecycle Policy.
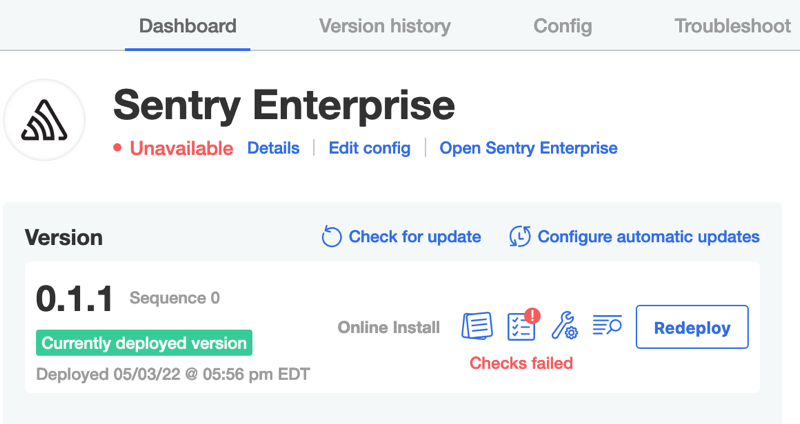
View status details
The application status displays on the dashboard of the Admin Console. Viewing the status details can be helpful for troubleshooting.
To view the status details, click Details next to the status on the dashboard.
About application status
To display application status on the Admin Console dashboard, KOTS aggregates the status of specific Kubernetes resources for the application.
The following resource types are supported for displaying application status:
- Deployment
- StatefulSet
- Service
- Ingress
- PersistentVolumeClaims (PVC)
- DaemonSet
Applications can specify one or more of the supported Kubernetes workloads listed above. KOTS watches all specified workloads for state changes.
For more information about how to interpret the application status displayed on the Admin Console dashboard, see Resource Statuses and Aggregate Application Status below.
Resource statuses
Possible application statuses are Ready, Updating, Degraded, Unavailable, and Missing.
The following table lists the supported Kubernetes resources and the conditions that contribute to each status:
| Deployment | StatefulSet | Service | Ingress | PVC | DaemonSet | |
|---|---|---|---|---|---|---|
| Ready | Ready replicas equals desired replicas | Ready replicas equals desired replicas | All desired endpoints are ready, any load balancers have been assigned | All desired backend service endpoints are ready, any load balancers have been assigned | Claim is bound | Ready daemon pods equals desired scheduled daemon pods |
| Updating | The deployed replicas are from a different revision | The deployed replicas are from a different revision | N/A | N/A | N/A | The deployed daemon pods are from a different revision |
| Degraded | At least 1 replica is ready, but more are desired | At least 1 replica is ready, but more are desired | At least one endpoint is ready, but more are desired | At least one backend service endpoint is ready, but more are desired | N/A | At least one daemon pod is ready, but more are desired |
| Unavailable | No replicas are ready | No replicas are ready | No endpoints are ready, no load balancer has been assigned | No backend service endpoints are ready, no load balancer has been assigned | Claim is pending or lost | No daemon pods are ready |
| Missing | Missing is an initial deployment status indicating that informers have not reported their status because the application has just been deployed and the underlying resource has not been created yet. After the resource is created, the status changes. However, if a resource changes from another status to Missing, then the resource was either deleted or the informers failed to report a status. | |||||
Aggregate application status
When you provide more than one Kubernetes resource, Replicated aggregates all resource statuses to display a single application status.
Replicated uses the least available resource status to represent the aggregate application status. For example, if at least one resource has an Unavailable status, then the aggregate application status is Unavailable.
The following table describes the resource statuses that define each aggregate application status:
| Resource Statuses | Aggregate Application Status |
|---|---|
| No status available for any resource | Missing |
| One or more resources Unavailable | Unavailable |
| One or more resources Degraded | Degraded |
| One or more resources Updating | Updating |
| All resources Ready | Ready |