Add custom graphs
This topic describes how to customize the graphs that are displayed on the Replicated Admin Console dashboard.
Replicated KOTS is available only for existing customers. For supporting installations into customer managed clusters, we recommend Helm. For more information, see About Helm Installations with Replicated.
KOTS is a Generally Available (GA) product for existing customers. For more information about the Replicated product lifecycle phases, see Support Lifecycle Policy.
Overview of monitoring with Prometheus
The KOTS Admin Console can use the open source systems monitoring tool Prometheus to collect metrics on an application and the cluster where the application is installed. Prometheus components include the main Prometheus server, which scrapes and stores time series data, an Alertmanager for alerting on metrics, and Grafana for visualizing metrics. For more information about Prometheus, see What is Prometheus? in the Prometheus documentation.
The Admin Console exposes graphs with key metrics collected by Prometheus in the Monitoring section of the dashboard. By default, the Admin Console displays the following graphs:
- Cluster disk usage
- Pod CPU usage
- Pod memory usage
In addition to these default graphs, application developers can also expose business and application level metrics and alerts on the dashboard.
The following screenshot shows an example of the Monitoring section on the Admin Console dashboard with the Disk Usage, CPU Usage, and Memory Usage default graphs:
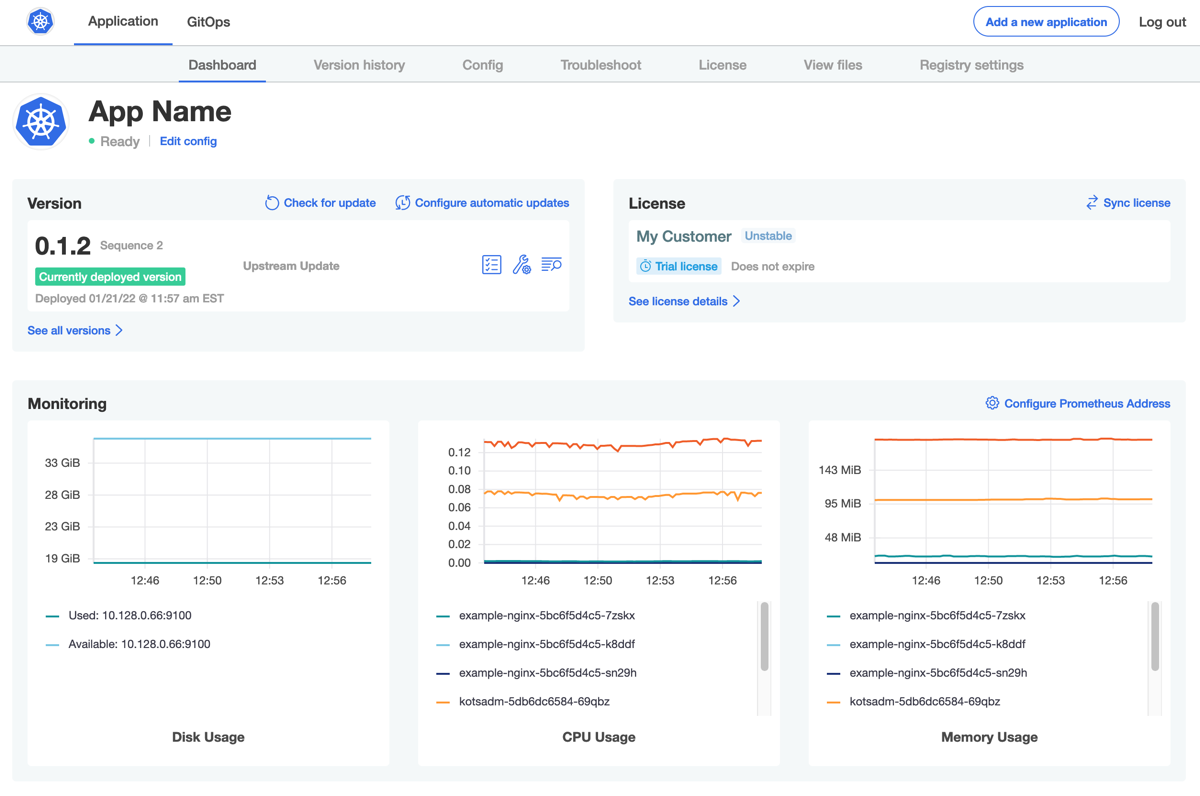
View a larger version of this image
About customizing graphs
If your application exposes Prometheus metrics, you can add custom graphs to the Admin Console dashboard to expose these metrics to your users. You can also modify or remove the default graphs.
To customize the graphs that are displayed on the Admin Console, edit the graphs property in the Replicated Application custom resource manifest file. At a minimum, each graph in the graphs property must include the following fields:
title: Defines the graph title that is displayed on the Admin Console.query: A valid PromQL Prometheus query. You can also include a list of multiple queries by using thequeriesproperty. For more information about querying Prometheus with PromQL, see Querying Prometheus in the Prometheus documentation.
By default, a kURL cluster exposes the Prometheus expression browser at NodePort 30900. For more information, see Expression Browser in the Prometheus documentation.
Limitation
Monitoring applications with Prometheus is not supported for installations with Replicated Embedded Cluster.
Add and modify graphs
To customize graphs on the Admin Console dashboard:
-
In the Vendor Portal, click Releases. Then, either click Create release to create a new release, or click Edit YAML to edit an existing release.
-
Create or open the Replicated Application custom resource manifest file.
-
In the Application manifest file, under
spec, add agraphsproperty. Edit thegraphsproperty to modify or remove existing graphs or add a new custom graph. For more information, see graphs in Application.Example:
The following example shows the YAML for adding a custom graph that displays the total number of user signups for an application.
apiVersion: kots.io/v1beta1kind: Applicationmetadata:name: my-applicationspec:graphs:- title: User Signupsquery: 'sum(user_signup_events_total)' -
(Optional) Under
graphs, copy and paste the specs for the default Disk Usage, CPU Usage, and Memory Usage Admin Console graphs provided in the YAML below.Adding these default graphs to the Application custom resource manifest ensures that they are not overwritten when you add one or more custom graphs. When the default graphs are included in the Application custom resource, the Admin Console displays them in addition to any custom graphs.
Alternatively, you can exclude the YAML specs for the default graphs to remove them from the Admin Console dashboard.
apiVersion: kots.io/v1beta1kind: Applicationmetadata:name: my-applicationspec:graphs:- title: User Signupsquery: 'sum(user_signup_events_total)'# Disk Usage, CPU Usage, and Memory Usage below are the default graphs- title: Disk Usagequeries:- query: 'sum((node_filesystem_size_bytes{job="node-exporter",fstype!="",instance!=""} - node_filesystem_avail_bytes{job="node-exporter", fstype!=""})) by (instance)'legend: 'Used: {{ instance }}'- query: 'sum((node_filesystem_avail_bytes{job="node-exporter",fstype!="",instance!=""})) by (instance)'legend: 'Available: {{ instance }}'yAxisFormat: bytes- title: CPU Usagequery: 'sum(rate(container_cpu_usage_seconds_total{namespace="{{repl Namespace}}",container!="POD",pod!=""}[5m])) by (pod)'legend: '{{ pod }}'- title: Memory Usagequery: 'sum(container_memory_usage_bytes{namespace="{{repl Namespace}}",container!="POD",pod!=""}) by (pod)'legend: '{{ pod }}'yAxisFormat: bytes -
Save and promote the release to a development environment to test your changes.