Configure custom metrics
This topic describes how to configure an application to send custom metrics to the Replicated Vendor Portal.
Overview
In addition to the built-in insights displayed in the Vendor Portal by default (such as uptime and time to install), you can also configure custom metrics to measure instances of your application running customer environments. Custom metrics can be collected for application instances running in online or air gap environments.
Custom metrics can be used to generate insights on customer usage and adoption of new features, which can help your team to make more informed prioritization decisions. For example:
- Decreased or plateaued usage for a customer can indicate a potential churn risk
- Increased usage for a customer can indicate the opportunity to invest in growth, co-marketing, and upsell efforts
- Low feature usage and adoption overall can indicate the need to invest in usability, discoverability, documentation, education, or in-product onboarding
- High usage volume for a customer can indicate that the customer might need help in scaling their instance infrastructure to keep up with projected usage
How the SDK sends custom metrics to the Vendor Portal
The Vendor Portal receives custom metrics from the Replicated SDK, which is installed in the cluster alongside the application.
The SDK exposes an in-cluster API where you can configure your application to PATCH and POST metric payloads. When an application sends data to the API, the SDK sends the data (including any custom and built-in metrics) to the Replicated app service. The app service is located at replicated.app or at your custom domain.
If any values in the metric payload are different from the current values for the instance, then a new event is generated and displayed in the Vendor Portal. This design reduces noise and helps you focus on actual changes in your customer deployments. For more information about how the Vendor Portal generates events, see How the Vendor Portal Generates Events and Insights in About Instance and Event Data.
The following diagram demonstrates how a custom activeUsers metric is sent to the in-cluster API and ultimately displayed in the Vendor Portal, as described above:
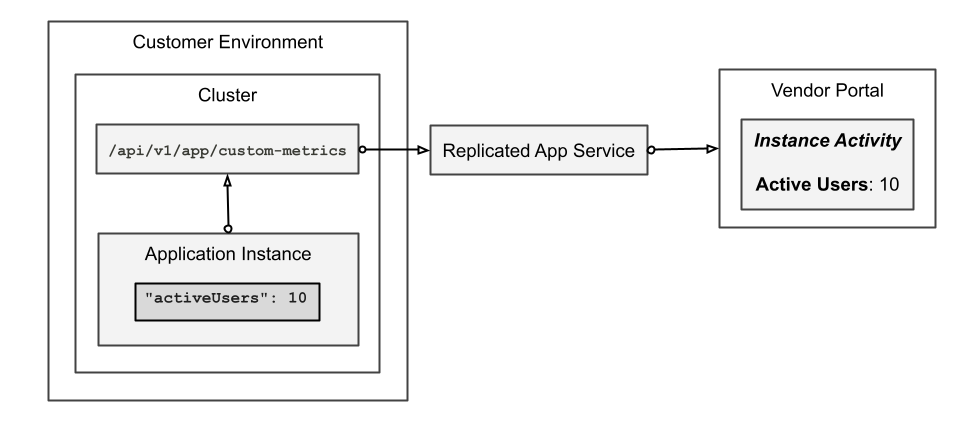
View a larger version of this image
Requirements
-
To support the collection of custom metrics in online and air gap environments, the Replicated SDK version 1.0.0-beta.12 or later must be running in the cluster alongside the application instance. If you have any customers running earlier versions of the SDK, Replicated recommends that you add logic to your application to gracefully handle a 404 from the in-cluster APIs. For more information about the Replicated SDK, see About the Replicated SDK.
-
The
PATCHandDELETEmethods described on this page require the Replicated SDK version 1.0.0-beta.23 or later.
Limitations
-
The label that is used to display metrics in the Vendor Portal cannot be customized. Metrics are sent to the Vendor Portal with the same name used in the
POSTorPATCHpayload. The Vendor Portal automatically converts camel case or snake case to title case: for example,activeUsersoractive_usersis displayed as Active Users. -
The SDK API accepts only JSON scalar values for metrics. Any requests containing nested objects or arrays are rejected.
Define custom metrics in JSON payload
You can define the custom metrics for your application as a set of key value pairs in a JSON metric payload. The payload must be valid JSON with proper content type headers.
Example:
{
  "data": {
    "active_users": 150,              // Number
    "cpu_usage_percent": 75.5,        // Number
    "sso_enabled": true,               // Boolean
    "deployment_region": "us-east-1", // String
  }
}
Supported data types
Custom metric names (keys) must be strings.
Custom metric values support these JSON types:
- Numbers (integers or decimals)
- Strings
- Booleans
- Null
The JSON payload must contain only scalar values. Nested objects or arrays are not supported.
Best practices for naming custom metrics
Metrics are displayed in the Vendor Portal with the same name that is used in the JSON payload. The Vendor Portal automatically converts camel case or snake case to title case: for example, activeUsers or active_users is displayed as Active Users.
To make it easier for team members to understand the instance reporting data for your application, Replicated recommends that you follow these best practices when naming custom metrics:
- Use descriptive names like
active_users. Avoid abbreviations likeau, vague names likeuser_metric, or overly verbose names likecurrent_active_users. - Use camel case or snake case. Don't use hyphenated names like
active-users. - Use camel or snake case consistently across all of your custom metrics.
Send custom metrics
You can configure your application to PATCH or POST a JSON metric payload to the SDK in-cluster API. For information about when to use PATCH or POST, see PATCH vs POST on this page.
The SDK API custom metrics endpoint is available at http://replicated:3000/api/v1/app/custom-metrics.
Nodejs example
The following example shows a NodeJS application that sends metrics on a weekly interval to the in-cluster API exposed by the SDK:
async function sendMetrics(db) {

    const projectsQuery = "SELECT COUNT(*) as num_projects from projects";
    const numProjects = (await db.getConnection().queryOne(projectsQuery)).num_projects;

    const usersQuery =
        "SELECT COUNT(*) as active_users from users where DATEDIFF('day', last_active, CURRENT_TIMESTAMP) < 7";
    const activeUsers = (await db.getConnection().queryOne(usersQuery)).active_users;

    const metrics = { data: { numProjects, activeUsers }};

    const res = await fetch('https://replicated:3000/api/v1/app/custom-metrics', {
        method: 'POST',
        headers: {
          "Content-Type": "application/json",
        },
        body: JSON.stringify(metrics),
    });
    if (res.status !== 200) {
        throw new Error(`Failed to send metrics: ${res.statusText}`);
    }
}

async function startMetricsLoop(db) {

    const ONE_DAY_IN_MS = 1000 * 60 * 60 * 24

    // send metrics once on startup
    await sendMetrics(db)
      .catch((e) => { console.log("error sending metrics: ", e) });

    // schedule weekly metrics payload

    setInterval( () => {
        sendMetrics(db, licenseId)
          .catch((e) => { console.log("error sending metrics: ", e) });
    }, ONE_DAY_IN_MS);
}

startMetricsLoop(getDatabase());
Patch vs post
Both the PATCH and POST methods record metrics with a timestamp, but they differ in how they handle your current metric state:
PATCH: Updates only the fields included in the JSON payload. Any other existing fields are unchanged. UsePATCHunless you need to explicitly remove metrics from the instance summary.POST: Replaces the current metric state. Any existing metrics that are not included in the JSON payload are removed from the instance summary. UsePOSTonly when sending your complete metric set each time.
For example, if a component of your application initially sends the following with the POST method:
{
  "numProjects": 5,
  "activeUsers": 10,
}
Then, the component later sends the following with the PATCH method:
{
  "usingCustomReports": false
}
Then the instance detail will show Num Projects: 5, Active Users: 10, Using Custom Reports: false, which represents the merged and upserted payload:
{
  "numProjects": 5,
  "activeUsers": 10,
  "usingCustomReports": false
}
However, if you use POST for the second call instead of PATCH, then the instance detail will show only Active Users: 10 and Using Custom Reports: false:
{
  "activeUsers": 10,
  "usingCustomReports": false
}
In this case, the previously-sent numProjects value is removed from the instance summary (though it remains accessible in the instance events history).
How often to send custom metrics
Replicated recommends that you add logic to your application to send metrics at regular intervals, such as daily or weekly.
Avoid sending metrics too frequently as it creates unnecessary noise. Custom metrics are best for periodic product statistics reporting rather than real-time monitoring.
For an example of application logic that sends custom metrics on a weekly interval, see NodeJS Example on this page.
Remove a custom metric
To remove an existing custom metric, use DELETE with the custom metric name. For example:
DELETE http://replicated:3000/api/v1/app/custom-metrics/num_projects
View custom metrics
You can view the custom metrics that you configure for each active instance of your application on the Instance Details page in the Vendor Portal.
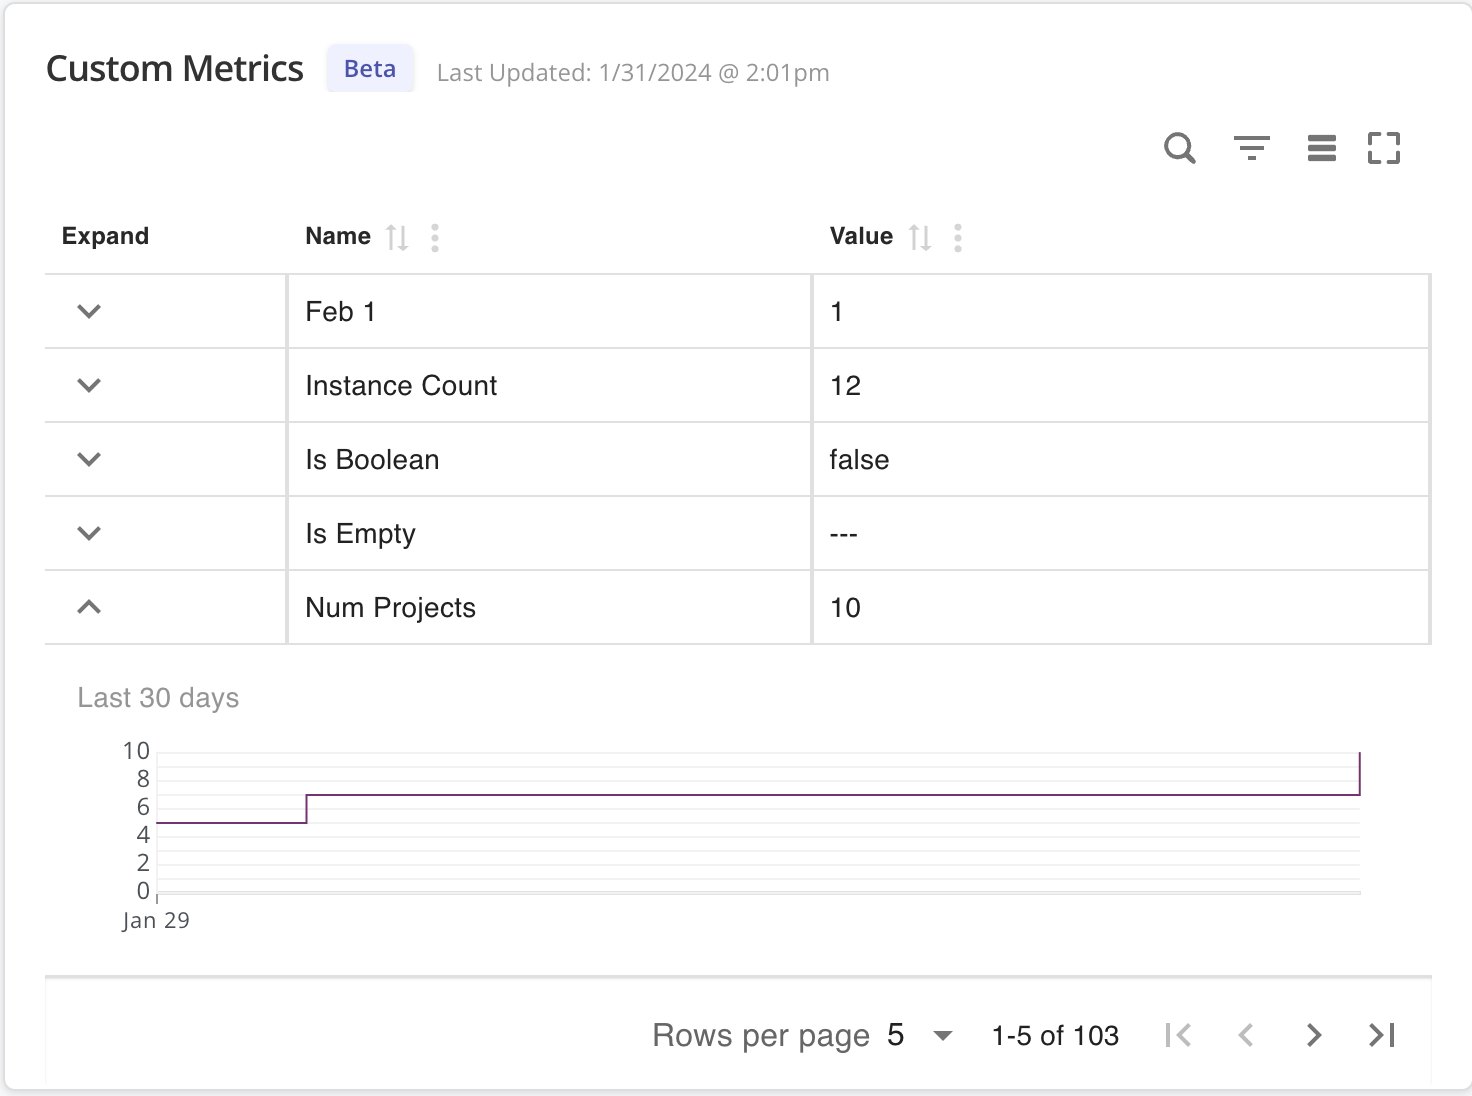
The following shows an example of an instance with custom metrics:
View a larger version of this image
As shown in the image above, the Custom Metrics section of the Instance Details page includes the following information:
- The timestamp when the custom metric data was last updated.
- Each custom metric that you configured, along with the most recent value for the metric.
- A time-series graph depicting the historical data trends for the selected metric.
Custom metrics are also included in the Instance activity stream of the Instance Details page. For more information, see Instance Activity in Instance Details.
Export custom metrics
You can use the Vendor API v3 /app/{app_id}/events endpoint to programmatically access historical timeseries data containing instance level events, including any custom metrics that you have defined. For more information about the endpoint, see Export Customer and Instance Data.
Troubleshoot custom metrics
Custom metrics not showing up in the Vendor Portal
Symptom
After your application sends a custom metric payload to the SDK API, one or more custom metrics are not displayed in the instance details in the Vendor Portal.
Cause
There are several possible reasons why a custom metric might not be showing up in the Vendor Portal, such as using an unsupported version of the SDK, invalid JSON, using POST rather than PATCH, or network connectivity issues.
Solution
To troubleshoot this issue:
- Ensure that the application instance is using the Replicated SDK version 1.0.0-beta.12 or later. If your application is using the
PATCHandDELETEmethods, version 1.0.0-beta.23 or later of the SDK is required. - Verify that your payload only contains scalar values (no nested objects or arrays), and is valid JSON with proper content type headers
- Test network connectivity by confirming that the application can reach
http://replicated:3000 - Check that your application is using the intended method (PATCH or POST). If a metric payload is sent using the POST method, any existing metrics that are not included in the payload are removed from the instance summary. For more information, see PATCH vs POST.
Duplicate events for unchanged values
Symptom
Instance reporting in the Vendor Portal displays duplicate events for one of your custom metrics, even though the metric's value was unchanged.
Cause
Your application logic might be computing values differently between calls.
Solution
To troubleshoot this issue:
- Review your metric collection logic to ensure consistent value calculation
- Check for floating-point precision issues with numeric values
- Verify that boolean values are consistently true or false and are not truthy or falsy conversions